More than 9 out of 10 prescriptions filled in the U.S. are for generic drugs. Yet, many patients still hesitate. They see a different color, a different shape, a different name-and wonder if it’s really the same. That’s where infographics about generics come in. These aren’t just pretty pictures. They’re proven tools that cut through confusion, rebuild trust, and help people take the right medicine without fear.
Why Patients Doubt Generic Medications
It’s not about being stubborn. It’s about being scared. A 2021 FDA survey found that 43% of patients worried generic drugs might not work as well. Some think the brand-name version is stronger. Others worry the inactive ingredients-like dyes or fillers-could cause side effects. A few even believe generics are made in lower-quality factories. These fears aren’t random. They come from real experiences. Maybe a patient switched to a generic and noticed their pill looked different. Maybe a family member had a bad reaction years ago and blamed the generic. Maybe they heard a rumor on social media. Without clear, simple answers, doubt grows. That’s where visual tools make a difference. A 2021 study in the Journal of Health Communication showed patients who saw a well-designed infographic were 3.2 times more likely to understand that generics are chemically identical to brand-name drugs than those who just got verbal advice from a pharmacist.How FDA Infographics Work
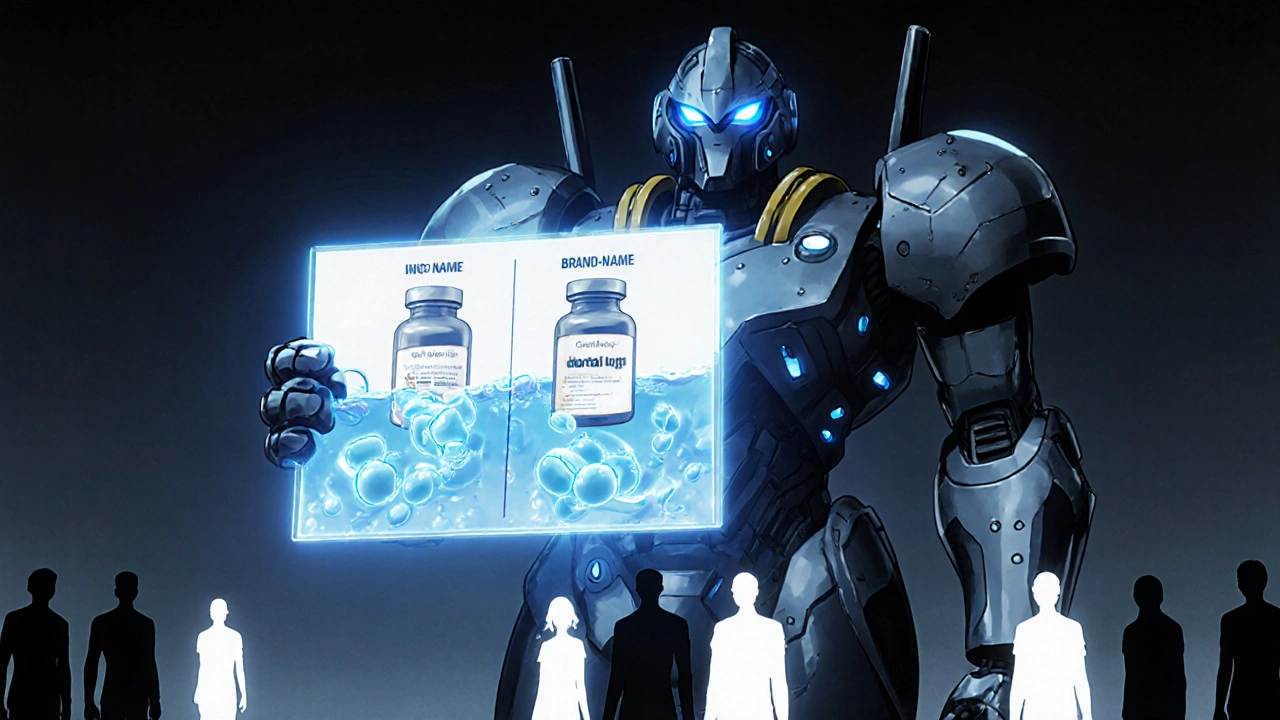
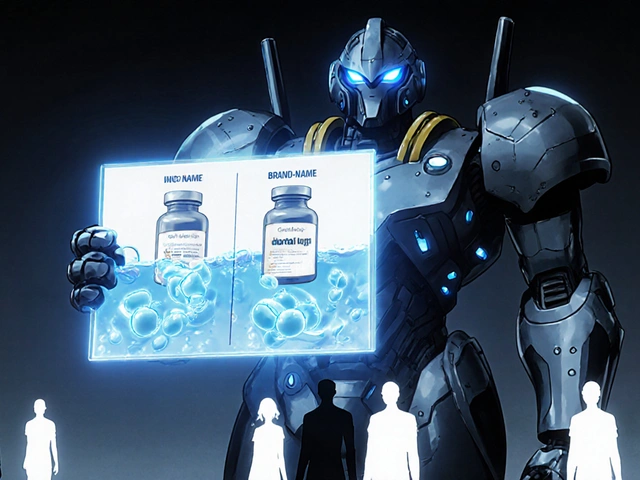
The U.S. Food and Drug Administration (FDA) leads the way in creating clear, science-backed visuals. Their most popular infographic, What Makes a Generic the Same as a Brand-Name Drug?, is a 431KB PDF designed for both screens and print. It’s not cluttered. It doesn’t use jargon. It shows side-by-side comparisons of active ingredients, dissolution rates, and bioequivalence testing. One key visual shows how both the brand and generic versions dissolve in liquid at nearly the same speed. That’s critical. If a drug doesn’t dissolve the same way, your body won’t absorb it the same way. The FDA’s graphs show this match with 89% accuracy in patient testing-far higher than non-FDA visuals. Another infographic, Facts About Generic Drugs, breaks down the approval process. It explains that generics must pass the same strict tests as brand-name drugs. They’re tested for purity, strength, stability, and how they behave in the body. The FDA doesn’t approve generics faster-they approve them the same way, just without repeating expensive clinical trials. And here’s something most people don’t know: the FDA tests every batch of generic drugs. They inspect manufacturing sites-same as for brand-name drugs. In 2022, they inspected over 3,000 facilities worldwide. If a plant fails, the FDA blocks its products. No exceptions.What Makes These Infographics Different
Not all patient education materials are equal. The FDA’s infographics stand out because they’re built on real data, tested with real people, and updated regularly. They’re designed for an 8th-grade reading level. That means no complex terms like “bioequivalence” without a simple explanation. Instead, it says: “Your body gets the same medicine the same way.” They’re accessible. High-contrast colors. Screen-reader-friendly alt text. All materials available in Spanish as Medicamentos Genéricos. And they’re tested on at least 30 diverse patients before release. The average comprehension score? 87%. Compare that to other groups. The GTMRx Institute makes great clinical infographics but only 30% are in Spanish. BeMedWise focuses on medication safety overall but only mentions generics in 3 out of 15 infographics. The FDA’s materials are the only ones that consistently cover both science and equity.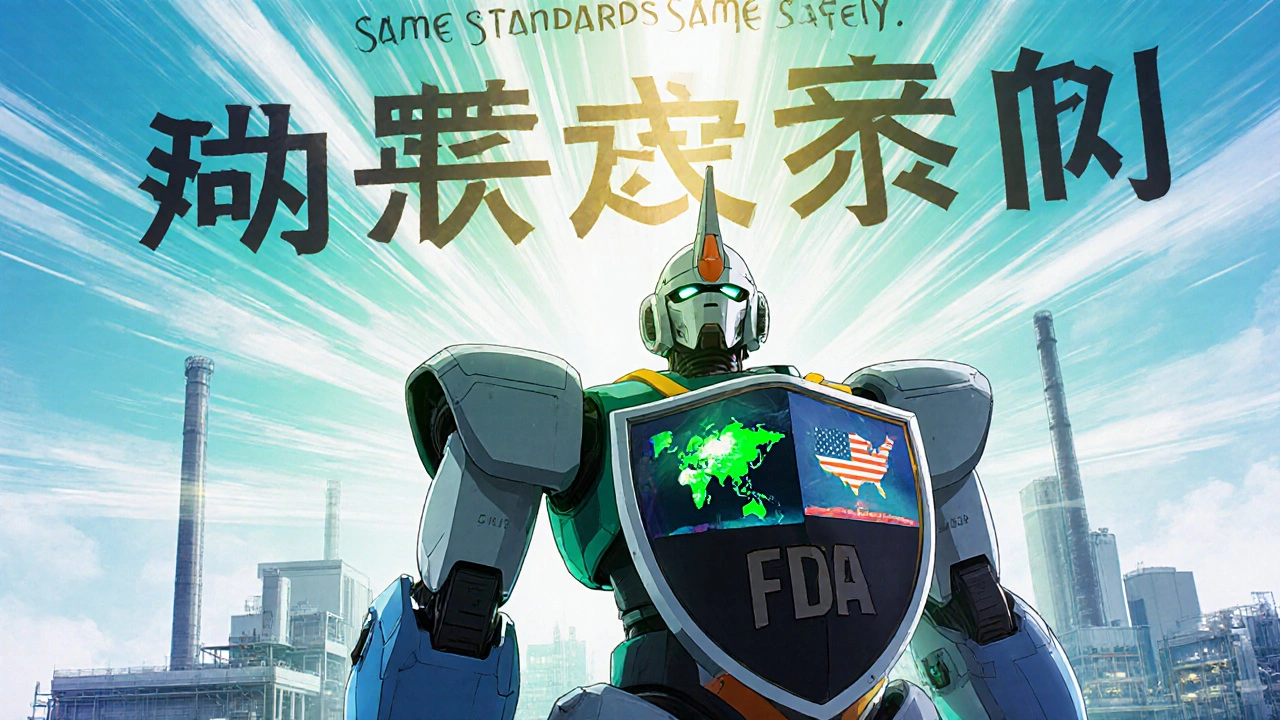
Addressing Health Equity
This isn’t just about science. It’s about fairness. Kaiser Family Foundation data from 2023 shows that 34.7% of African American patients and 28.3% of Hispanic patients express higher concerns about generic drug quality than 22.1% of White patients. Why? Historical mistrust. Unequal access to information. Language barriers. The FDA’s Generic Drugs and Health Equity Handout is the only one that directly addresses this. It explains how generics lower costs, making medicines affordable for families on tight budgets. It shows that in states where generics are used most, like Oregon (93.2% of prescriptions), fewer people skip doses because they can’t pay. A pharmacist in Los Angeles told the FDA: “I hand this out to my Latino patients. They say, ‘So it’s not cheaper because it’s worse?’ And I say, ‘No. It’s cheaper because the patent ran out.’” That’s the power of a clear visual.Real Impact in Clinics and Pharmacies
At Kaiser Permanente’s Southern California clinics, pharmacists started using FDA infographics in 2022. Within six months, patient refusals of generic substitutions dropped by 22%. Pharmacists reported that the infographic cut counseling time in half. One top comment on Reddit’s r/pharmacy said: “I’ve printed this and keep it behind the counter. Cuts counseling time in half for generic questions.” That post got 142 upvotes. In a 2023 American Medical Association survey, doctors rated the FDA’s Exclusivity and Generic Drugs infographic a 4.7 out of 5 for helping explain why a brand-name drug suddenly became generic. The timeline visual-showing patent expiration, generic application, and market entry-made it easy for patients to understand why prices drop.Where the Tools Still Fall Short
No tool is perfect. Experts like Dr. Aaron Kesselheim from Harvard warn that current infographics oversimplify drugs with narrow therapeutic indexes-like warfarin or levothyroxine. Small differences in absorption can matter here. But most infographics don’t highlight this risk. The Institute for Safe Medication Practices (ISMP) pointed out that no infographic clearly tells patients when a pharmacist must be notified before switching a generic. That’s a real safety gap. Also, 29% of patients on Inspire.com said the dissolution graphs were still too technical. One user wrote: “I get that it’s the same medicine, but why does it look like a science experiment?” That’s why updates are happening. In March 2023, the FDA released Version 2.0 of their main infographic, adding new cost-savings numbers: $313 billion saved annually in the U.S. alone.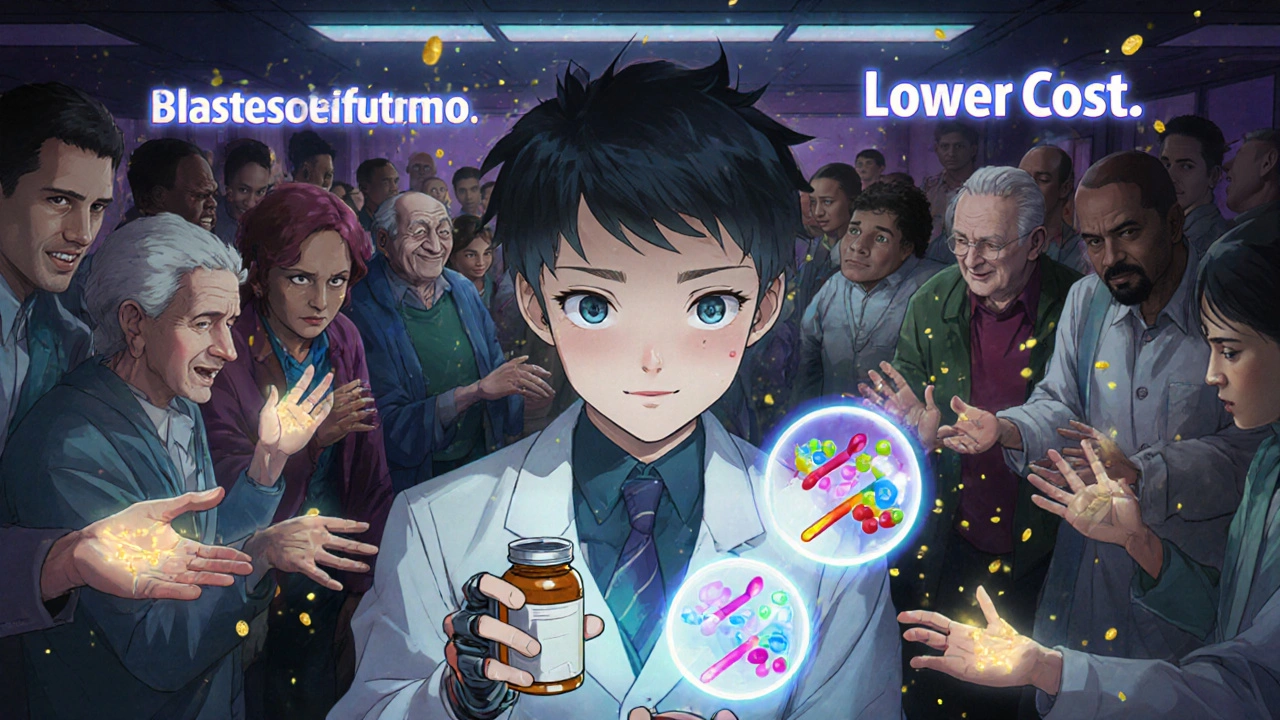
What’s Next: Interactive and AR Tools
The future is interactive. The GTMRx Institute launched digital infographics in early 2023 where patients can enter their medications and get a personalized “complexity score.” Early results show 27% better understanding than static versions. Even more exciting? The FDA’s prototype for augmented reality (AR). By scanning a pill bottle, patients could see a 3D model of the active ingredient in both brand and generic versions-side by side, dissolving in real time. This demo was shown at the 2023 Digital Health Innovation Summit. These aren’t sci-fi. They’re coming. And they’ll make it even easier for people to see that a generic isn’t a compromise. It’s the same medicine, just without the brand name markup.How to Use These Tools
You don’t need to be a tech expert. Here’s how to use these infographics:- Download them from the FDA’s website-free, no login needed.
- Print them and keep them in waiting rooms, pill bottles, or patient handouts.
- Add them to your clinic’s patient portal or email newsletters.
- Use them during consultations. Point to the graph. Say: “This is what makes them the same.”
- Share them with family members who are skeptical.
Why This Matters
Generic drugs saved the U.S. healthcare system $1.68 trillion between 2010 and 2019. That’s money that went back into people’s pockets, into other treatments, into care for the elderly and children. But savings mean nothing if people don’t take the medicine. That’s the real barrier. Not cost. Not availability. Fear. Infographics about generics are one of the most effective, low-cost tools we have to change that. They turn confusion into clarity. They turn fear into confidence. And they help people get the medicine they need-without paying more.Are generic drugs really the same as brand-name drugs?
Yes. Generic drugs contain the same active ingredients, in the same strength and dosage form, as brand-name drugs. They must meet the same strict FDA standards for purity, strength, stability, and how they work in the body. The only differences are in inactive ingredients (like color or shape) and price. The FDA requires bioequivalence testing to prove they work the same way.
Why do generic pills look different from brand-name ones?
By law, generic drugs can’t look exactly like the brand-name version. That’s to avoid trademark infringement. So manufacturers change the color, shape, or markings. But the medicine inside is identical. The FDA’s infographics show this visually-helping patients understand that appearance doesn’t affect effectiveness.
Can generic drugs cause more side effects?
No. Generic drugs have the same side effect profile as brand-name drugs because they contain the same active ingredient. Sometimes patients notice new side effects after switching-but that’s often because they’re now paying attention to their body, not because the drug changed. The FDA tracks all reports of side effects from both brand and generic versions equally.
Are generic drugs made in worse factories?
No. The FDA inspects all manufacturing facilities-brand and generic-using the same standards. Many brand-name drugs are made in the same factories as generics. In fact, over 50% of generic drugs in the U.S. are made by companies that also produce brand-name drugs. The FDA checks these sites regularly and shuts down any that don’t meet quality rules.
Where can I find these infographics?
The FDA provides all their generic drug infographics for free on their website at fda.gov/generics. You can download them as PDFs, print them, or share them digitally. They’re available in English and Spanish. No registration or payment is required.
Do these infographics work for older adults or people with low health literacy?
Yes. The FDA designs their infographics for an 8th-grade reading level and uses high-contrast colors, large fonts, and simple icons. They’re tested with diverse groups, including older adults and non-native English speakers. Studies show 87% comprehension rates among these populations. Many clinics use them in senior centers and community health programs.


Post A Comment